
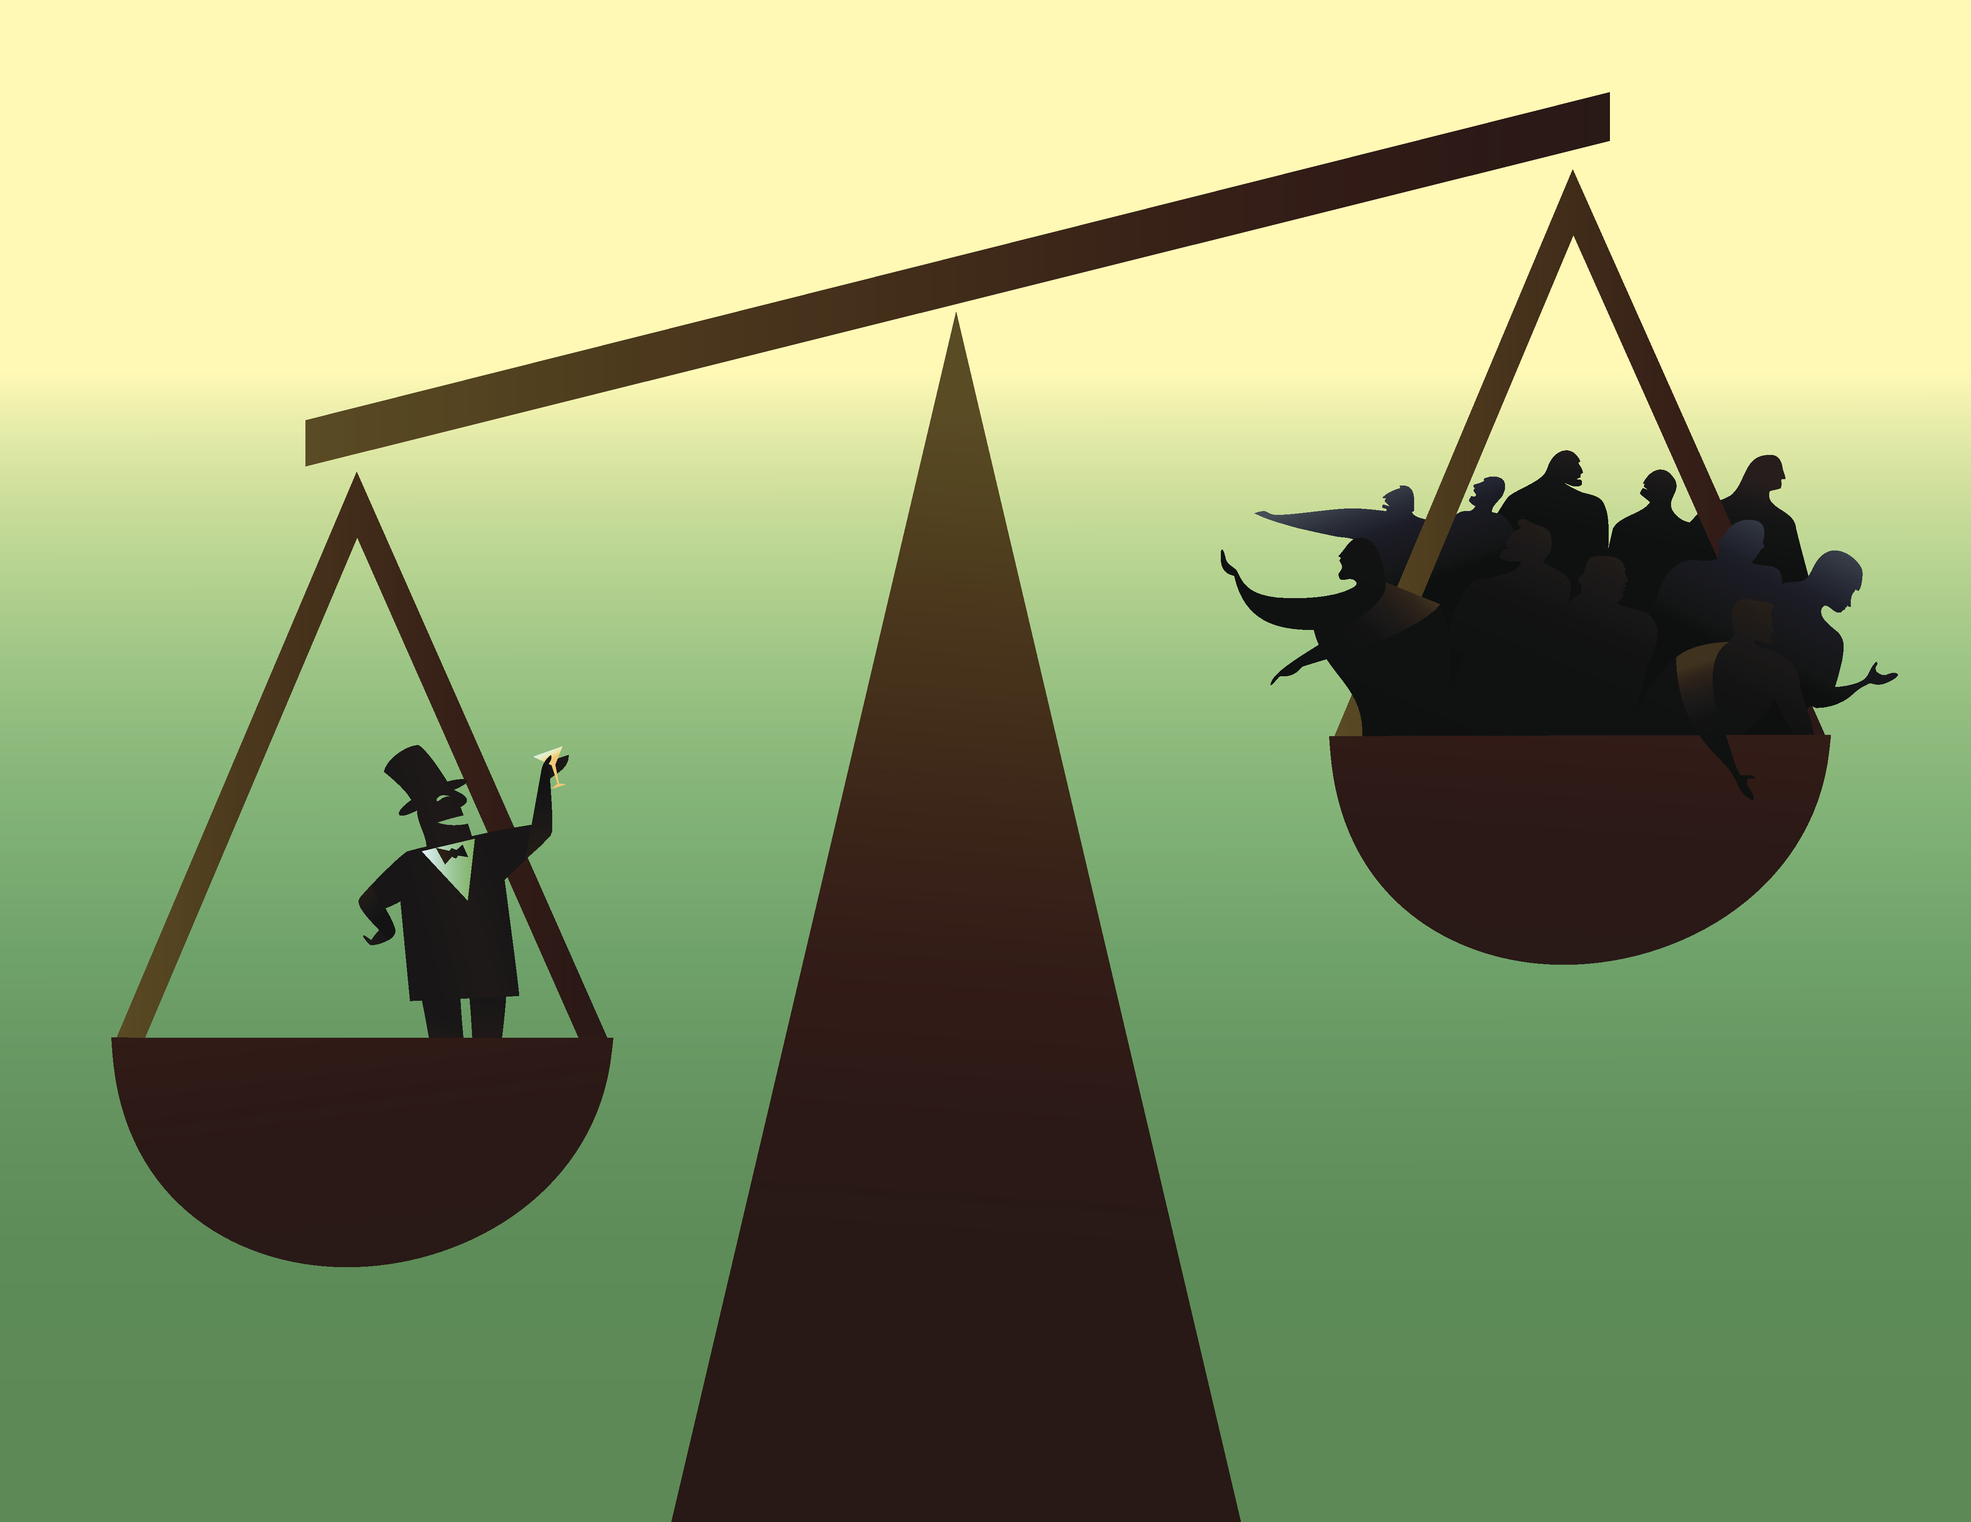
It is by now a cliche that inequality in rich countries has grown within the last 40 years. The most honest observers will concede that this phenomenon is accompanied by an extraordinary reduction in the number of those around the world who live below the poverty line. Not all Western countries are equal, and the picture is decidedly nuanced, particularly in regard to Italy, where, before COVID-19, inequality remained at essentially the same level for years. The United States, on the other hand, has seen a disparity in the distribution of income. In the country that is the leader of the free world, the rich have grown increasingly richer and the poor ever poorer since the presidency of Ronald Reagan.
Former Texas Sen. Phil Gramm, a trained economist, along with economist Bob Ekelund and statistician John Early, has just published a book that suggests things are not quite what they appear. The central discovery of “The Myth of American Inequality” (Rowman and Littlefield, 2022) is shocking: The official statistics of the U.S. Census Bureau don’t take into account taxes, which reduce the income of the rich, nor transfer payments, which increase the income of the poor. Both are of a certain relevance in establishing how many Americans meet the Census Bureau’s own definition of poverty. According to the Census Bureau, the lowest quintile of the population consumes more than double the income than those selfsame statistics attribute to them: $26,000 versus $13,258.
Gramm, Ekelund and Early maintain that the alarm bells should have sounded in 2020, when the Census Bureau reported how the average family income had decreased by 2.9% and 3.3 million more Americans had fallen into poverty. However, in 2020, to counteract the effects of the pandemic, public spending increased by 50% and the federal government issued a flood of subsidies.
The point, explain Gramm, Ekelund, and Early, is that some of these are not considered in the official statistics “because the income numbers used to calculate the official poverty rates don’t count refundable tax credits as income to the recipients.” Similarly, the Census Bureau “doesn’t count food stamps, Medicaid, the Children’s Health Insurance Program, rent subsidies, energy subsidies and health-insurance subsidies under the Affordable Care Act.” In total, there are more than 100 different types of transfer payments that disappear from the Census Bureau reports.
Americans pay around $4.4 billion in taxes every year, 82% of which is paid by 40% of taxpayers in the highest income brackets. Not only does the Census Bureau fail to take transfer payments for the poorest into account, it doesn’t even consider the reduction of income that is the inevitable outcome of paying taxes. The result is the view of American society that everyone is familiar with: the rich are getting richer, and the poor are getting poorer.
It is probably a distorted image, even net of taxes. Gramm, Ekelund, and Early offer an illuminating example. The cellphone only entered the Consumer Price Index in 1998. From then until now, cellphones have undergone impressive technological advancements; not only are the possibilities that a current phone offers barely even comparable to the cellphones of the past, but the statistics don’t consider any of that. The stats don’t even take into account the approximately 75% reduction in the price of cellphones that occurred since they entered the market at the beginning of the 1980s until 1998. Technological advances have outfitted even the cheapest cars with security and comfort that was unimaginable in top end vehicles 40 years ago, and what about televisions and computers? None of that is included in the national statistics.
Taxes and transfer payments should be included, however. The former reduce some individuals’ income, and the latter increase the income of others. If corrected to include all taxes and transfer payments, the actual disposable income of the top 20% of taxpayers compared to that of the bottom 20% would go from 16.7 to 1 (according to the Census Bureau) to a more modest 4 to 1. That is, the available income of the richest taxpayers is four times, not 17 times, that of the poorest.
Above all, Gramm, Ekelund and Early’s updated statistics suggest that income inequality in the United States has decreased by 3% since 1947, rather than increasing by 22.9% as the Census Bureau’s measurements indicate.
Gramm, Ekelund, and Early’s book is well documented and coldly rational, but it is useless to delude ourselves about its impact.
Europeans tend not to recognize just how much the United States, from Lyndon B. Johnson’s “Great Society” onward, is a fully fledged social state; therefore, the idea of growing disparity reinforces our prejudices. Many Americans share this perspective. On the right, they are convinced they are “different” from the rest of the world, on the left, they despair for the very same reason. However, taxes, transfer payments, and public spending in the U.S. are lower compared to French and Italian standards, and yet not so much compared to other European countries. In order for it not to have an effect on income distribution, you would have to spend this cash in a far worse way than we spend it in our countries. It is a hypothesis which not even the most socialist of Europeans could, in good conscience, give credit to.
Leave a Reply
You must be logged in to post a comment.