

For a couple of weeks and since the plummeting of the oil value by more than 60 percent, the market is reflecting upon itself. Are black gold prices ready for a solid rebound after the rebound occurring these last few days, or is this all theatrics?
Investors scrutinize each piece of information since they have fewer and fewer landmarks: They are held hostage between the most pessimistic estimations, which foresee the price of oil going back to $20 a barrel (Citi and Goldman Sachs hint $30), and the temptation to fall back on a sector where several values are slaughtered. As a result, a “new” indicator has become one of the most followed publications by oil markets: the rig count. In a few weeks, this figure, published every Friday at 7 p.m. (Paris GMT) since 1944 by Baker Hughes (a U.S. oil service company), has become the barometer of black gold prices. Booking the number of oil rigs in activity, it provides a clear picture of the impact of a decrease in the oil price on the activity of U.S. shale gas operators. And since a few weeks, this figure is free falling. Since October 2014, the number of oil rigs in activity has decreased by more than 34 percent – i.e. there are 1056 oil rigs remaining. It is this very decrease that urged several investors to fall back on black gold, anticipating that this oil rig drop would lead to a production decline and therefore balance international oil supply and demand.
In the short term, this bet seems nevertheless a bit risky because this figure does not tell the whole story, and it is imperative to look beyond raw data. Different types of oil rigs exist, and they do not have the same yields. We can discriminate between the classical vertical wells and the more recent horizontal wells, which utilize the fracking technique – i.e. hydraulic fracturing. The latter, developing horizontally in the bedrock containing oil, have a far superior yield to the horizontal wells whose reach is limited.
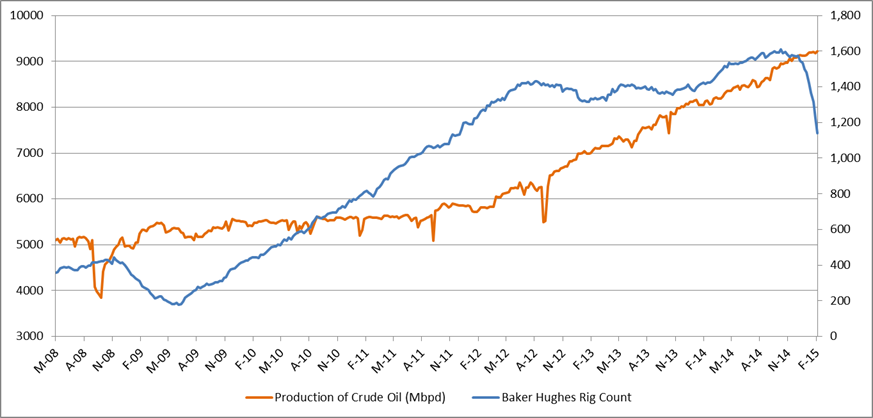
Nevertheless, the number of oil rigs is not the whole story. In view of the high production of wells after their initial opening, the temporary drop in oil rigs does not necessarily translate into a drop in productivity. The new wells could in fact have a higher productivity than the ones reaching maturity. That is what happened in the gas industry in 2008-09, when, following the financial meltdown, investments in oil rigs slowed down in the USA. Here is a graphic putting in perspective the number of oil rigs and productivity in the U.S.
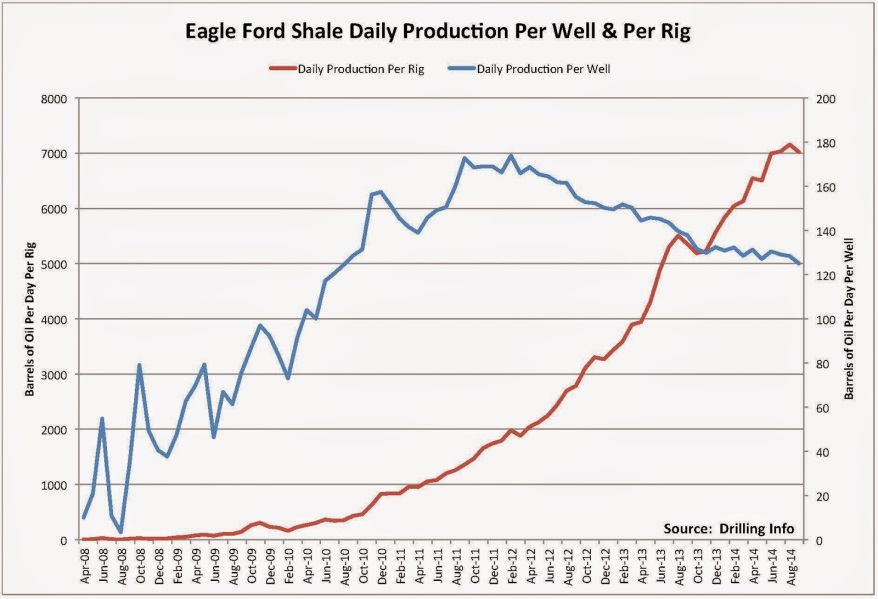
Nonetheless, the situation has changed. In fact, one of the main reasons behind the progression of production in 2008 were the productivity gains obtained through shale oil drilling (notably thanks to pad drilling), and not on the wells themselves. By opting for an optimization of the utilization of drilling heads in drilling four wells at a time, producers have managed to increase considerably the number of wells without increasing the number of machines in activity. Nevertheless, today, it seems productivity has capped. The extremely quick depletion rate of this type of wells implies that, in order to maintain production rates, it is necessary to keep on going senselessly. In fact, as time passes, the number of rigs that needs to be replaced is greater. Henceforth, oil production would be more correlated to the number of drill heads in activity than the number of wells in activity – as this chart displays.
Therefore, while average production by drilling head has almost tripled since the beginning of 2012, average production per well dropped by a third over the same period. While almost a third of drill heads are already not in activity, and the trend seems to be amplifying, the production of shale oil could drop a lot more quickly than what mainstream experts have announced. It seems far fetched to expect a price of oil at $20 despite what many predict today …
Leave a Reply
You must be logged in to post a comment.